Exploring Tools for Profiling Java Applications
Every Java developer aims to produce code that’s not only remarkable but also operates at peak efficiency. However, the act of meticulously managing the numerous internal components of the Java Virtual Machine (JVM) to guarantee stellar performance, especially for complex enterprise applications, is no simple feat.
The quest for application efficiency presents a plethora of puzzles. Developers need to determine the memory their code consumes and understand how tweaks to the code or its architecture might sway its efficiency. There’s an urgency to track memory consumption within the app, oversee Garbage Collection processes, scrutinize CPU usage, and beyond. This wealth of information is vital for pinpointing potential enhancements and swiftly addressing any emerging performance hiccups. Navigating these performance quandaries has consistently been a daunting endeavor for Java aficionados.
To tackle this maze of obstacles head-on, Java developers should equip themselves with a toolkit explicitly crafted to observe various JVM metrics. Of all the available resources, Java profilers emerge as the pivotal tools, crucial for keeping their application’s performance at its zenith.
Understanding Java Profilers
In the software development sphere, Java Profiling stands out as an essential technique, centered around a thorough examination of applications to detect memory and performance glitches. Essentially, a Java Profiler serves as an advanced code surveillance tool, proving invaluable for Java developers across diverse situations. Functioning within the realms of the JVM (Java Virtual Machine), these profilers penetrate the nuances of Java bytecode activities. Dive into a detailed exploration of the nature and capabilities of Java profilers:
Key Functions of a Java Profiler:
Java profilers are versatile instruments designed to perform several critical tasks, making them indispensable for developers:
- Thread Execution Monitoring: Profilers keep a watchful eye on the execution of threads, allowing developers to spot any irregularities or bottlenecks in concurrent processes;
- Object Creation Analysis: They provide insights into the creation of meaningful objects within the code, aiding in resource optimization;
- Method Execution Tracking: Profilers meticulously track the execution of different methods, shedding light on performance bottlenecks or inefficiencies;
- Garbage Collection Management: Effective garbage collection handling is crucial for maintaining optimal memory usage, and profilers play a pivotal role in monitoring and optimizing this aspect.
Advantages of Utilizing a Java Profiler:
The adoption of a Java profiler brings forth a multitude of benefits:
- Performance Statistics: Profilers furnish developers with comprehensive statistics regarding the code’s performance, allowing for data-driven improvements;
- Error Identification: They expedite the process of identifying errors, sparing developers the arduous task of sifting through extensive codebases repeatedly;
- Concurrency Issue Resolution: Profilers excel in addressing issues stemming from multi-threading processes, leading to enhanced code efficiency and resource utilization.
Choosing the Right Java Profiler
Profiling is not a one-off endeavor but a continuous process integral to software development. To ensure seamless monitoring and issue resolution, selecting the right Java profiler is paramount. With a plethora of options available, making an informed choice is essential. Here are ten of the best Java profilers to consider:
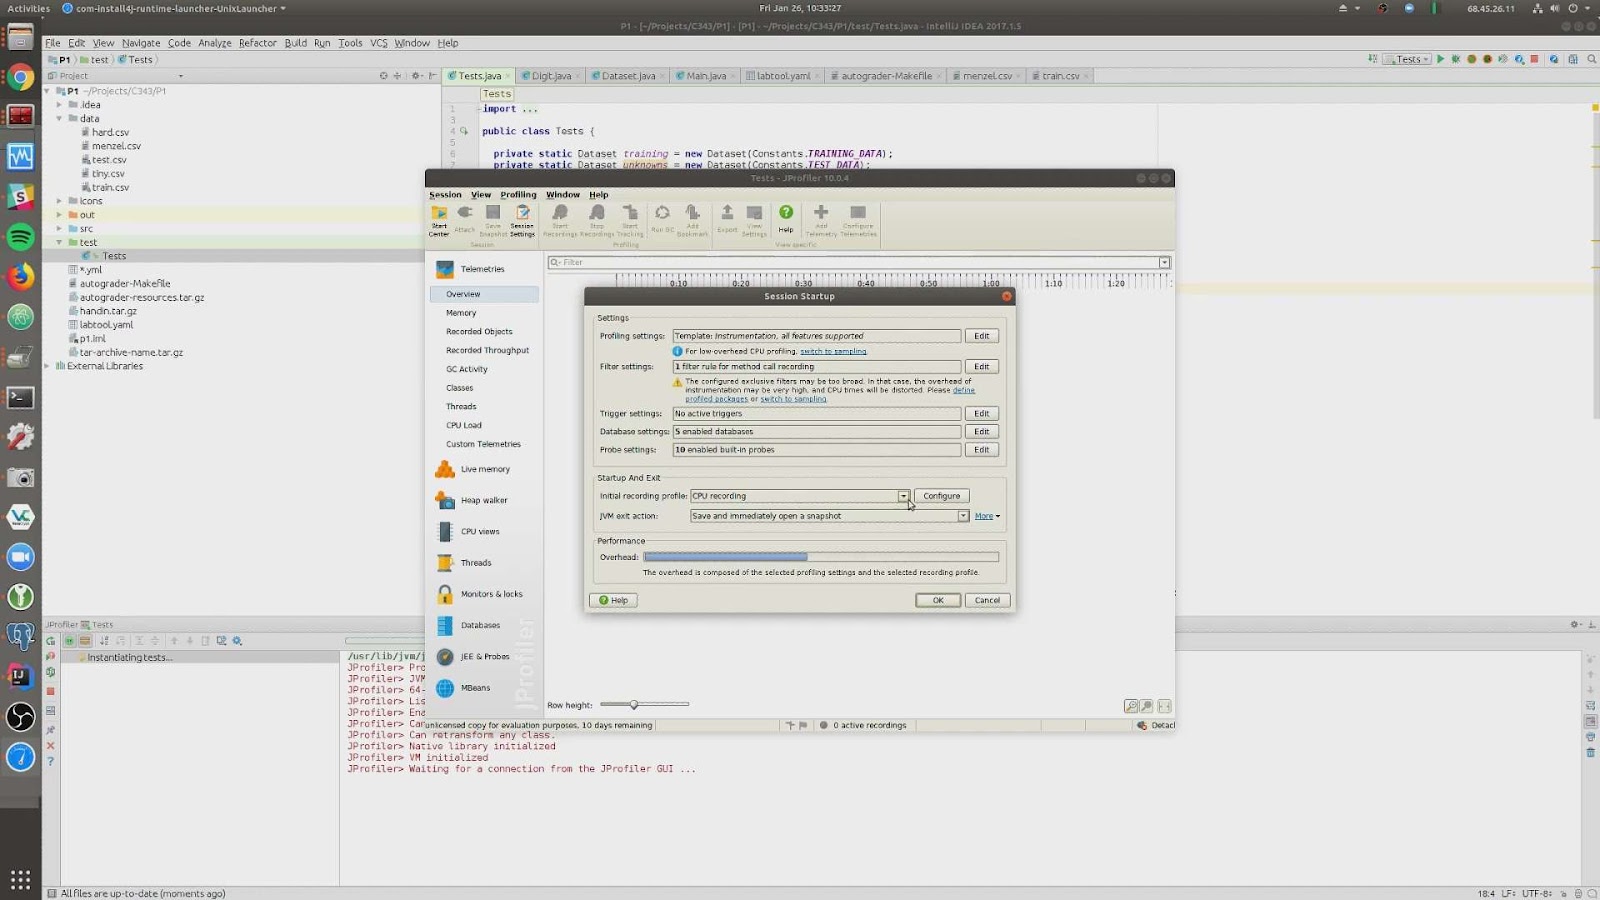
1. JProfiler: Precision Perfected in Profiling
A preferred choice among Java developers, JProfiler excels in profiling both conventional and enterprise-grade applications. Its harmonious blend with prominent Java Integrated Development Environments (IDEs) amplifies its usability. Beyond integration, JProfiler offers a suite of tools crafted to refine and elevate the profiling journey.
Distinguished Features:
- Holistic System Evaluation: JProfiler stands out in its ability to dissect and provide insights into the entire system’s performance, laying the groundwork for informed optimization decisions;
- Mastery in Threads Profiling: Aided by its tools, developers can effortlessly oversee and dissect threads, spotlighting potential areas of congestion or inefficiency;
- Vigilance in Memory Management: With JProfiler’s astute detection mechanism, it becomes relatively easier to locate and rectify areas of excessive memory usage.
Investment Overview:
- Conventional Individual License: Begins at $499;
- Educational Individual License: Offered at a reasonable $199, designed explicitly for academic endeavors.
2. YourKit: A Legacy of Profiling Excellence
YourKit, a stalwart in the Java profiling landscape, presents a commendable selection of profiling instruments. Its expansive features encompass local to remote profiling, automation capabilities, and in-depth insights into CPU usage, memory management, and thread interactions.
Standout Attributes:
- Visualization of Performance: Navigate system efficiency via intuitive telemetry diagrams;
- Thread Intelligence: Garner an exhaustive perspective on thread engagements, enhanced with nuanced filters like “Live,” “Both Live and Concluded,” and “Concluded” threads;
- Insight into Garbage Collection: Deep-dive into the garbage collection mechanics, enriching the strategy for memory stewardship.
Financial Considerations:
- Inaugural License Package: Starts at $499, bundling in a year of dedicated support and upgrade privileges.
3. Java VisualVM: Where Elegance Intersects Capability
Java VisualVM, bundled with the Java Development Kit (JDK), offers an equilibrium of simplicity and prowess. Further enhancing its appeal is its fluid integration with a host of JDK tools, including but not limited to JConsole, jinfo, and jmap.
Features Worth Mentioning:
- Broad-Ranging Compatibility: Effortlessly compatible with both proximate and distant virtual machines;
- Real-time Process Oversight: Enables vigilant monitoring of process configurations and respective environments;
- Performance and Memory Surveillance: Aptly equipped to observe and profile system efficiency and memory allocations;
- Thread Analytics: Offers granular insights into thread dynamics, supplemented by diverse filtering alternatives;
- Session Capture Utility: Provides the convenience of recording profiling sessions for subsequent scrutiny.
Price Point:
Complimentary Use: As an inherent component of the JDK, Java VisualVM offers a budget-friendly avenue for developers seeking value without the price tag.
4. XRebel/JRebel: Revitalizing Java Development Expeditions
Emanating from zeroturnaround’s tech vaults, XRebel, a featherlight Java Profiler, bears a familial connection with the illustrious JRebel. Together, these siblings emerge as a formidable force in Java development, presenting an alliance that’s hard for developers to bypass.
The Dynamic Interplay of XRebel and JRebel:
Harnessing both XRebel and JRebel concurrently ushers in a novel paradigm in profiling and development:
- Panoramic Performance Insights: XRebel equips developers with the tools to dissect application performance in its entirety, acting as a beacon to detect any stealthy performance anomalies during the formative development stage;
- Swift Code Assessment: JRebel’s ace is its ability to sidestep cumbersome redeployments. Developers can swiftly witness alterations and, courtesy of XRebel, gauge if these shifts usher in the anticipated performance betterment.
The XRebel Advantage: Efficiency Unleashed:
XRebel’s hallmark lies in its ability to liberate developers from time-consuming redeployments, propelling them faster towards achieving peak performance — a claim few profilers can uphold.
Streamlined Synergy:
Recent advancements in plugins for Eclipse and IntelliJ champion the harmonized usage of XRebel and JRebel right within the cozy confines of an Integrated Development Environment (IDE). This collaboration amplifies XRebel/JRebel’s worth for Java aficionados.
Web Applications Integration Made Simple:
Infusing XRebel into web applications is a breeze. A singular VM argument does the trick. Subsequently, a petite icon graces the bottom left corner of each webpage, beckoning users to the XRebel interface.
Investment Insights:
XRebel extends a gracious two-week trial period for explorers. Post-trial, its licensing is judiciously pegged at $1/day, culminating in a modest annual commitment of $365.
5. NetBeans Profiler: The Unsung Virtuoso
While NetBeans enjoys a reputation for its debuggery finesse, it also shelters a lesser-known marvel – the NetBeans Profiler. Nestled within Oracle’s open-source NetBeans IDE, this profiler emerges as a delightful discovery for the Java community.
Twin Talents of the Profiler:
NetBeans Profiler is a multitasker. Beyond its stellar profiling abilities—covering the gamut from CPU runtime evaluations, real-time code behavior dissections, to object inception tracking—it also shines as a debugging ally. It adeptly steers through the convoluted maze of multi-threaded complexities and anomalies. A happy side effect? The amplification of application swiftness and memory thriftiness.
Price and Reach:
NetBeans Profiler’s allure is amplified by its sheer accessibility. Available for free and ripe for fetching from the official portal, it carves a niche over Java VisualVM, another complimentary toolkit, by presenting an encompassing suite within the IDE.
Expert Endorsement:
Integrating NetBeans Profiler within your developmental ecosystem promises a harmonious meld of profiling and debugging faculties. Its intrinsic alignment with the NetBeans IDE ensures a unified developmental ambiance, bolstering your prowess as a Java maestro. Factor in its economic allure, and it becomes an enticing prospect for budget-conscious developers.
6. Java Interactive Profiler (JIP): Profiling Redefined
Meet Java Interactive Profiler (JIP), a fully Java-coded profiler engineered for precision in performance analysis. JIP shines as a lightweight yet potent toolset, brimming with promising features for Java developers seeking effective profiling solutions.
Dynamic Measurement Control:
One standout feature of JIP is its ability to dynamically control measurements with ON and OFF switches. This means you can selectively enable or disable profiling for specific parts of your code, granting you fine-grained control over your analysis.
Platform Agnostic Profiling:
JIP is platform-agnostic, capable of running on any platform that supports Java. Its versatility extends further with the “javaagent” option, empowering users to load classes and modify bytecode on-the-fly during class loading. This flexibility is a boon for developers seeking adaptable profiling solutions.
Efficient Memory Management:
Efficiency is at the core of JIP’s design. It efficiently manages memory usage, ensuring that profiling operations do not become resource-intensive or cause unwanted overhead.
Seamless Debugging:
JIP doesn’t stop at profiling; it facilitates easier debugging with filtering options based on classes or packages. This means you can swiftly pinpoint and address issues in your code, enhancing the development and optimization process.
Open-Source Freedom:
JIP stands as an open-source profiler, a factor that resonates strongly with the Java developer community. Its open nature not only makes it accessible to all but also invites contributions and improvements from developers worldwide.
7. Stackify Prefix: Elevating Java Profiling
Stackify Prefix is a formidable contender in the realm of Java profiling. This feature-rich profiler offers unique profiling tools designed to provide comprehensive insights into your Java web applications.
Granular Web Request Monitoring:
One of Prefix’s standout features is its ability to display detailed information about every web request. This feature is a game-changer for developers, as it enables monitoring of each step within a Java web application and measures the time taken for each operation. This level of granularity empowers developers to identify bottlenecks and optimize their web apps effectively.
Tracing Distributed Requests:
Prefix goes a step further by assisting Java developers in tracing distributed requests. This is invaluable for debugging and optimizing applications that rely on distributed systems or microservices.
Code Improvement Suggestions:
Prefix doesn’t just stop at profiling; it also provides actionable code improvement suggestions. Developers receive recommendations for code fixes that can enhance the efficiency and performance of their applications.
Two Versions for Varied Needs:
Stackify Prefix offers two versions:
- Standard Version: Free and accessible to all Java developers;
- Premium Version: Packed with additional features, making it a direct competitor to tools like XRebel.
8. Java Mission Control (JMC): Unleash the Power of Profiling
Java Mission Control (JMC) stands as a robust JDK profiling tools platform tailored specifically for HotSpot JVM. In the world of Java profiling, JMC emerges as a go-to suite for performance monitoring, memory management, and real-time profiling equipped with diagnostics tools.

Versatile Toolset:
JMC comes equipped with a versatile arsenal of java profiler tools that empower developers and administrators in multiple ways:
- Java Management Console (JMX): This tool serves as a robust solution for monitoring and managing Java applications. It enables real-time tracking of an application’s performance metrics and resource utilization;
- Java Flight Recorder (JFR): JFR is a standout profiling tool within JMC, offering in-depth insights into the behavior of your Java applications. It records and analyzes various aspects of application execution, helping identify bottlenecks and performance issues.
Free and Accessible:
One of JMC’s compelling features is accessibility. It can be used freely on desktops or laptops for development purposes or within production environments. This accessibility ensures that developers have the necessary profiling tools at their disposal, irrespective of their development or deployment environment.
9. Eclipse Profiler: The Memory Maestro
The Eclipse profiler is a treasure trove of java profiler tools that excels in memory management and memory leak detection. It has long been a trusted companion of Java programmers, offering a suite of indispensable features for heap analysis and memory management.
Efficient Memory Management:
Eclipse’s profiling capabilities shine when it comes to memory management. It not only detects memory leaks but also provides the means to pinpoint their sources. This is invaluable for ensuring that your Java applications run efficiently without unnecessary resource consumption.
Simplified Heap Analysis:
Navigating the complexities of heap memory is made simpler with the Eclipse profiler’s intuitive user interface. It offers clear and insightful visualizations of heap memory usage through graphical representations. Key memory metrics, such as Used memory, Total memory, and Free memory, are readily available, allowing developers to make informed decisions.
User-Friendly Interface:
The Eclipse profiler takes pride in its user-friendly interface, designed to enhance the profiling experience. Developers can seamlessly explore heap memory data and quickly identify areas of improvement using the provided filters and graphs.
10. JProbe: Diagnosing and Enhancing Java Applications
JProbe, a robust toolkit developed by Quest Software, is a Java developer’s trusted ally in the pursuit of application optimization and error resolution. Designed to diagnose and eliminate inefficiencies and errors in Java applications, JProbe stands as a versatile and indispensable profiling solution.
JProbe Profiler: Visualizing Performance:
JProbe Profiler is the star of the show, seamlessly blending a visual Graph interface with advanced data collection technology. This synergy allows developers to gain highly accurate insights into their application’s performance, going beyond merely identifying issues to understanding their root causes. Here’s how JProbe Profiler sets itself apart:
Key Features of JProbe Profiler:
- Visual Performance Data: The integration of visual graphs provides developers with an intuitive way to interpret performance data;
- Accurate Diagnostics: JProbe Profiler excels in pinpointing performance problems, helping developers identify bottlenecks, resource hogs, and other impediments to optimal execution;
- Root Cause Analysis: What sets JProbe apart is its emphasis on understanding the root causes of errors and performance issues. This deep dive into the “why” behind issues empowers developers to make informed improvements.
The JProbe Suite: Comprehensive Application Monitoring:
JProbe’s value extends beyond profiling. The JProbe Suite comprises three additional tools, each dedicated to a specific aspect of application monitoring and optimization:
1. JProbe Memory Debugger:
Detects and eliminates memory leaks, enhancing application performance by optimizing memory usage and minimizing garbage collection overhead.
2. JProbe Threadalyzer:
Tackles thread-related problems, including deadlocks, thread stalls, and race conditions. It identifies actual or potential threading issues that could jeopardize application data integrity.
3. JProbe Coverage:
Assists developers and quality assurance engineers in identifying unexecuted code within the application. This tool is invaluable for unit testing and user acceptance test runs.
Comprehensive Guide to Java Profiler Pricing and Affordable Alternatives
When diving into the world of Java profilers, one of the most significant factors that developers and businesses consider is the cost. It’s essential to invest in a tool that delivers the best value for its price. Here’s a deeper look into some popular Java profiler price points:
- XRebel: Known for its robust capabilities, XRebel stands out as a strong choice for many. However, its annual subscription fee is approximately $365, which may be on the higher end for smaller businesses or individual developers;
- JProfiler and YourKit: Both of these profilers are recognized in the Java community for their comprehensive features. Their pricing, which can exceed $400 annually, reflects their extensive capabilities and puts them in the premium segment of Java profiler tools;
- Other Paid Profilers: Many Java profilers from established companies tend to hover around the same price range, often making them a considerable investment.
The Challenge for Small and Mid-Tier Companies:
High-end Java profilers can be an investment that not all businesses can afford. Larger enterprises might not find these prices daunting, but for small to mid-sized companies, such costs can be prohibitive.
Enter Open-Source Solutions:
Fortunately, the open-source community has come to the rescue, offering some noteworthy alternatives:
Benefits of Open-Source Java Profilers:
- Cost-Effective: Often available for free or at a lower cost, making them accessible to all;
- Community Support: Benefiting from a community of developers, these tools often receive regular updates and improvements;
- Flexibility: Open-source tools are typically more customizable, allowing developers to tailor them to specific needs.
Recommendations for Open-Source Java Profilers:
- Consider your needs and what specific functionalities you’re looking for;
- Browse reputable open-source platforms like GitHub to find well-supported tools;
- Read reviews and seek recommendations from the Java developer community.
Conclusion
In today’s digital landscape, Java developers increasingly rely on effective Java profilers to enhance their applications’ performance during the developmental stage.
We’ve delved into the realm of profiling and highlighted premier Java Profilers. The onus of selecting the ideal profiler lies with developers, contingent upon the depth of analysis and data needed by the development ensemble.
No Comments
Sorry, the comment form is closed at this time.